Airbnb investment properties for sale, ranked by what they actually earn.
The independent underwriter for short-term-rental investors buying abroad: every villa, apartment and holiday home ranked by net yield built from occupancy and nightly rates measured on real Airbnb calendars.
Watch the 1-minute filmFree account — unlimited full property analyses, no credit card. Or try the Airbnb calculator
How these numbers are measured
What the counts mean. “Airbnb listings tracked” counts the listings our pipeline currently follows — every one still live on Airbnb when we last searched its market; delisted listings drop out. Every day the pipeline reads the calendar of each tracked listing above its market's price floor (1,886,852 calendars read on 5 Oct 2026). “Countries & territories” counts the pipeline's country tags — the UAE, and island territories such as Bonaire and St Barts, among them. “Calendar nights observed” counts listing-night observations — one per listing, per night, per day it was read — the raw material of every occupancy figure. “For-sale listings tracked” counts every row across our nine market tables, staged and delisted ones included; each market row shows only what you can browse today. Every figure is read from the pipeline itself; the daily one names the day it counts. Per-market occupancy is the median of actively-rented listings (≥25 days of calendar data, ≥10% occupancy) over the trailing quarter — measured from real Airbnb calendars, not all tracked listings. Each market row leads with its top 10% by BrixfoxScore: the median net yield of the listings scoring in the top decile — fully managed, after that country's tax, over the all-in acquisition cost (price plus that market's transfer, notary, legal, furnishing and launch costs) — selected on score, never on yield, so stale prices and short-tail leaseholds can't inflate it. The gross yield beside it (annual STR revenue ÷ asking price) is the figure portals quote, kept for comparison. A catalogue median describes what agencies list as much as what a market earns (Dubai is 39% off-plan, Bali 84% leasehold), which is why the comparison leads with the cohort. Each listing page shows its own fully-managed, after-tax net yield on all-in cost.
Nine markets, one basis, ranked by net yield
Live for-sale catalogues from local agencies and national portals, underwritten on Airbnb calendars we track ourselves. Every figure below is the same scenario on the same cost basis.
Updated hourly · pipeline last wrote 14 Oct 2026, 16:35 UTC
 Dubai — Marina, JVC, Downtown & Palm Jumeirah14.0% gross · 67% occ · 41,071 listingsmanaged, no income tax, on all-in cost · freeholdFreehold apartments and villas, USD-priced; short-let-restricted communities flagged, measured Airbnb activity around every listing.7.6%net · top 10%
 Netherlands — Zeeland coast, Wadden Islands, Veluwe & South Limburg22.5% gross · 60% occ · 5,489 listingsmanaged, after Box 3, on all-in cost · koop · erfpacht flaggedHoliday homes, EUR-priced; the park letting rules read from every listing and shown as signals, never permissions.6.9%net · top 10%
 Thailand — Phuket, Koh Samui & Koh Phangan16.8% gross · 67% occ · 8,117 listingsmanaged, after Thai tax, on all-in cost · freehold condos, leasehold villasForeign-quota condos and leasehold villas, USD-priced; the Hotel Act warning on every listing, never a licence claim.6.8%net · top 10%
 Bali & Lombok — Canggu, Uluwatu, Ubud & the Bukit17.0% gross · 70% occ · 7,942 listingsmanaged, after Indonesian tax, on all-in cost · leasehold & freeholdVillas, USD-priced; tourism zoning resolved per listing and the leasehold years priced into every yield.6.7%net · top 10%
 Greece — Crete, the Cyclades, the Dodecanese & the Ionian islands18.6% gross · 71% occ · 3,150 listingsmanaged, after Greek rental tax, on all-in cost · freeholdFreehold island villas and apartments, EUR-priced; the AADE registration number shown when a listing discloses one and never asserted by us — Greece publishes no registry to check it against.6.4%net · top 10%
 ABC Islands — Aruba, Bonaire & Curaçao15.1% gross · 62% occ · 847 listingsmanaged, after each island’s own tax, on all-in cost · freehold-dominantFreehold-dominant villas and apartments across three Dutch Caribbean jurisdictions, each with its own transfer tax, property tax and rental-income rules; the smallest Brixfox catalog, and no listing is presented as licensed — none of the three publishes a register we can check.5.9%net · top 10%
 Spain — Balearics, Canary Islands, Costa del Sol & Costa Brava14.6% gross · 68% occ · 16,781 listingsmanaged, after non-resident tax, on all-in cost · freeholdFreehold villas, EUR-priced, beside 40,000+ live Spanish Airbnb calendars; all-in = price + ITP + notary + legal + furnishing; the regional licence regime (ETV, VV, VUT, HUT plus the national NRA) named on every area.5.5%net · top 10%
- Italy — Puglia, Sicily, Tuscany, Sardinia, the Amalfi Coast, Liguria & the lakes18.7% gross · 63% occ · 16,387 listingsmanaged, after cedolare secca, on all-in cost · freeholdFreehold villas and apartments, EUR-priced; the all-in cost carries the transfer tax, the notary and the agency commission an Italian buyer pays, and the national CIN is shown when a listing discloses one, never asserted by us — there is no public lookup to check it against.4.2%net · top 10%
 Portugal — Algarve, Lisbon Coast, Silver Coast & Madeira9.3% gross · 77% occ · 18,311 listingsmanaged, after Portuguese tax, on all-in cost · freeholdFreehold villas and apartments, EUR-priced; the AL licence status shown per listing, register-verified where the RNAL number resolves.3.8%net · top 10%
Top 10% by BrixfoxScore, selected on score, never on yield. Every market on fully-managed, after-tax net over all-in acquisition cost. Gross is on asking price.
Bali: freehold rows are costed as the lawful route for a foreign buyer — a PT PMA company holding HGB title — with BPHTB, the title conversion, company setup and its yearly compliance; a foreigner cannot hold Hak Milik directly.
Spain: the regional short-let regime (ETV, VV, VUT, HUT) and the national NRA are named per area; whether a licence exists at a listing, and whether it transfers with the sale, is stated on the listing only where a register or the agency shows it.
Not sure where to start? Ask.
Any market, area or budget. Answers come from the live for-sale catalogue, with a link to every listing.
Questions are stored for 12 months to improve our answers. Privacy
Live Airbnb market data in 13 more countries
Airbnb occupancy rates, nightly rates and RevPAR by area, measured from daily calendar snapshots and published ahead of each market's for-sale catalogue — so you can compare the best countries for an Airbnb investment on measured numbers, and the performance history is already there when a catalogue opens.
Occupancy and ADR are observed from live Airbnb calendars across each market’s tracked window — or, where a market already has completed months of night-by-night history, over those months only — weighted by tracked listings: the same headline figures the market page shows. ADR reflects asking prices; upcoming months show booking pace to date and typically rise as the month approaches. Nightly rates in USD. A market moves to a for-sale catalogue when its data quality and buyer demand justify it — every one of these pages already takes waitlist signups.
Collecting · 30 more countries & territories
These markets are in daily Airbnb calendar collection but not published yet: their history is still too short to state an occupancy rate. A forward calendar cannot observe nights that have already passed, so we show the tracked listing count only, and publish occupancy and nightly rates once each market has completed months of observed history behind them.
See what any location earns — in seconds
Pick a market for live occupancy heatmaps and its top-earning areas, then click any spot for an instant Airbnb revenue estimate from the real listings we track around it.
Every listing, underwritten like an analyst would
Not a portal with pretty photos — a full Airbnb investment analysis on every property: true net yield built from real short-term-rental performance, not estimates, surveys or guesses. Listings come from 40+ vetted local agencies and the major national portals; performance data refreshes daily from live calendars.
Built by founders who spent 15 years running villas in Bali — now underwriting them with real data.
Read the narration
On paper, every listing looks like a great investment.
But from abroad, you can't check the bookings, the fees, or the tax.
Brixfox tracks over a million Airbnb listings, and reads hundreds of thousands of calendars a day. So demand is measured, not guessed.
Then we underwrite every property for sale, the way an analyst would.
Take this one-bed in Downtown Dubai: fourteen percent a year, on paper.
Add the purchase fees. Take off management, cleaning, platform fees and upkeep.
Income tax? In Dubai, zero.
What you actually keep: eight percent.
We've done this for more than eighty thousand properties, across eight markets, so you can compare them on one basis.
Independent of the agencies. Every number shows its source.
Brixfox. Know your yield, before you buy.
Browse ranked listings — free, no account
Every card carries measured occupancy, nightly rate and net yield. Catalogues default to BrixfoxScore order, so the highest-scoring listings are what you see first.
Browse ranked listingsUnderwrite it with a free account
Unlimited full analyses: the Airbnb comps behind each number, the all-in acquisition cost for that market, the 5-year return and the years to payback.
Order the report, then talk to the agency
A one-time $49 underwriting report on a property in Bali, Portugal, Greece, Italy, the Netherlands or Dubai — its purchase costs, line-by-line P&L, occupancy and offer what-ifs, and the market’s ownership, tax and letting rules. Send your inquiry to the listing agency straight from the property page.
What the report containsTrue net yield
Net of taxes, notary, legal, furnishing and STR launch costs — the return you actually keep, not a gross headline. Each market has its own cost model; none inherits another’s.
BrixfoxScore, A+ to F
Every property graded across eight pillars — yield, location, ownership security, demand, land and more. A quality score, not a yield sort.
Backed by real comps
Occupancy and ADR pulled from the actual Airbnb listings around each property — shown with the observation window and caveats, so you can check our work.
Return & payback
Projected 5-year total return per year and years-to-payback from rental income alone, with leasehold terms discounted where they apply.
The same engine, on any location
The free Airbnb calculator runs the comp engine on any pin in any covered market — before a property is even listed for sale.
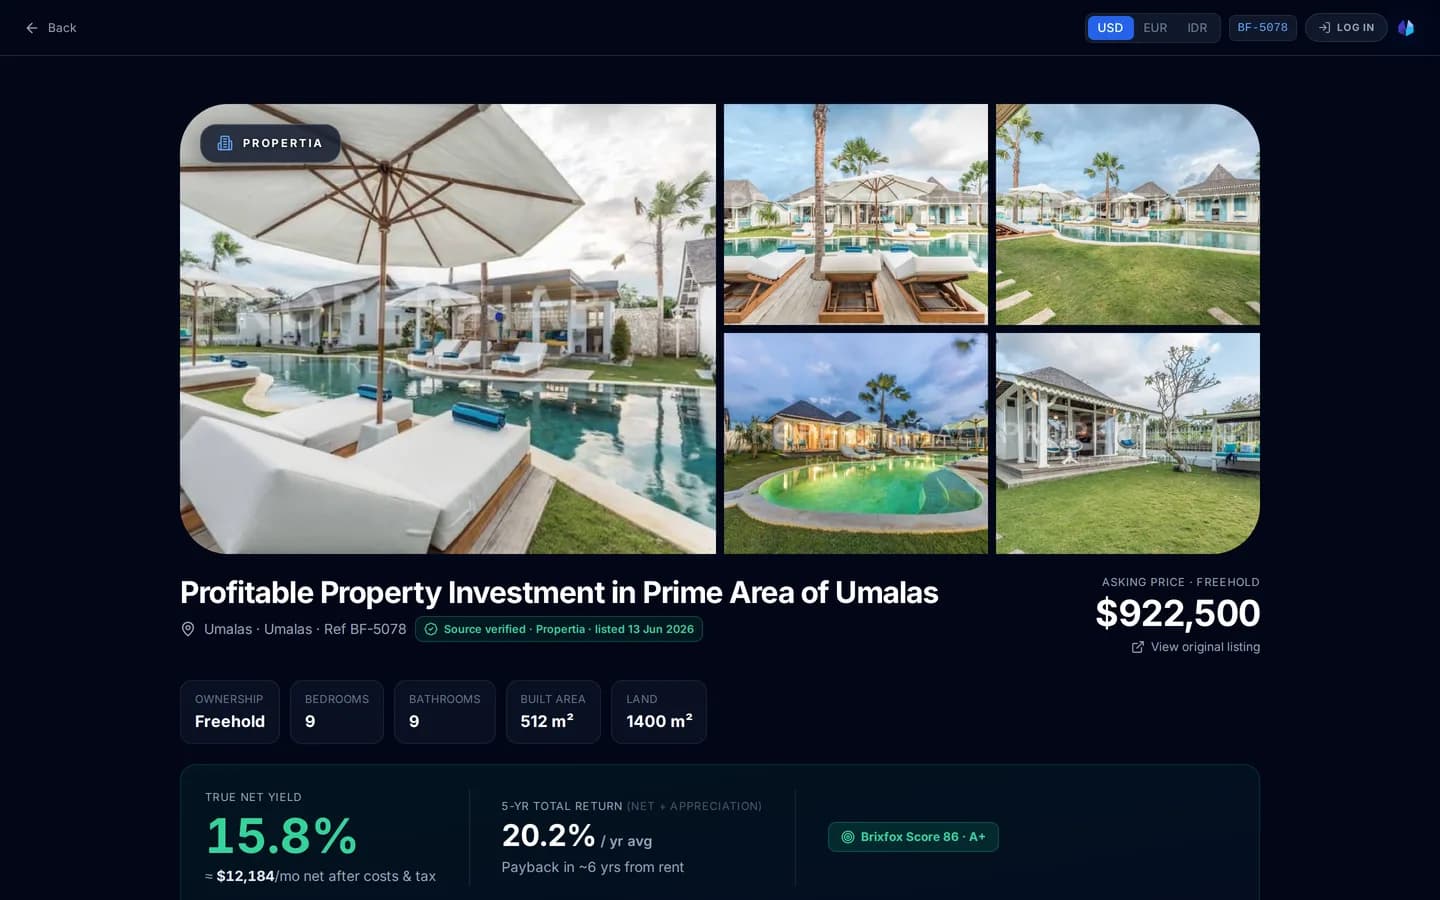
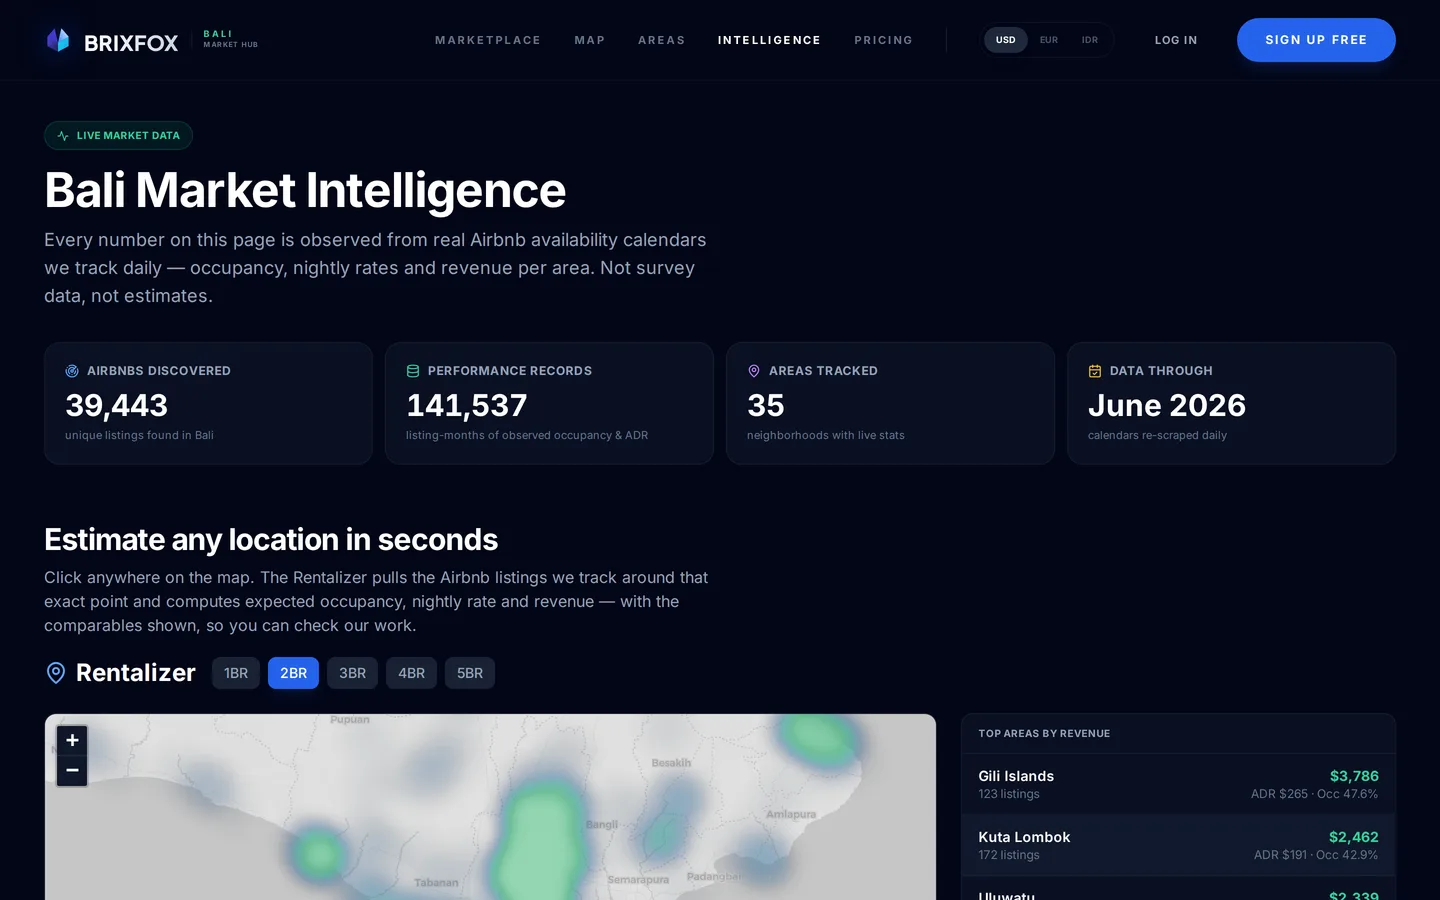
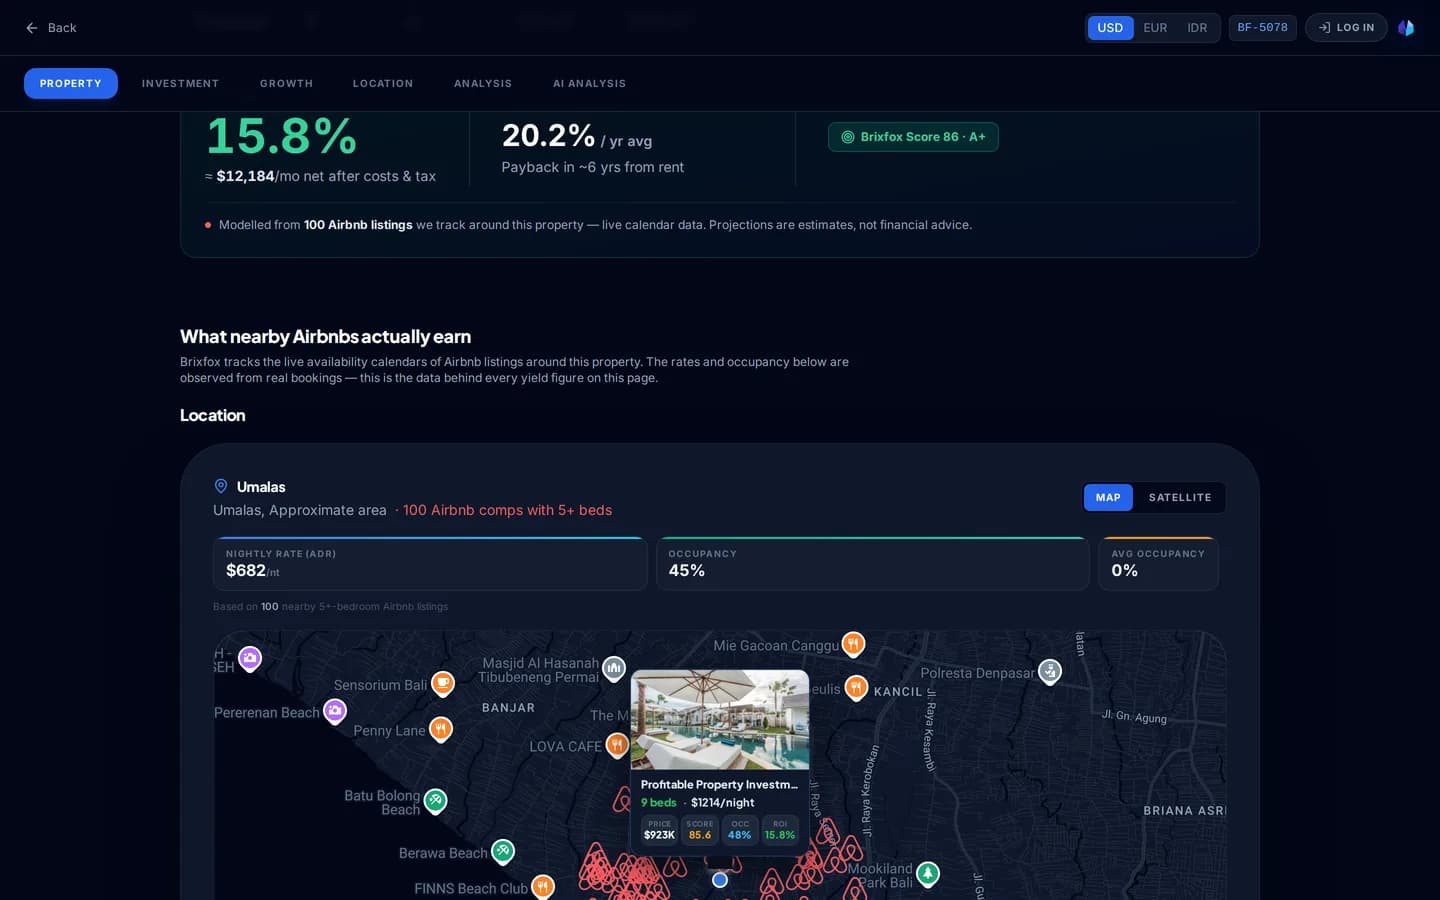
Built by operators who've actually run the villas.
Brixfox was founded by Ted and Rogier, who spent roughly 15 years building — and ultimately selling — a villa rental business in Bali.
We've lived the gap between a glossy for-sale listing and what a property actually earns once it's on Airbnb. Brixfox closes that gap — independent of the agencies, with every number carrying the basis it was built on — so you can underwrite a villa in Canggu or an apartment in the Algarve with real numbers from wherever you are.
Frequently asked questions
What is Brixfox?
Brixfox is the independent underwriter for short-term-rental investors buying abroad. We aggregate for-sale listings from trusted local agencies and national portals, then rank every property by what the Airbnbs around it measurably earn — occupancy, nightly rates and net yield read from live calendars we track ourselves, not from brochure projections. Every number shows the comparable listings, the observation window and the caveats it was built on.
Which markets does Brixfox cover?
Nine flagship markets in depth: Bali & Lombok in Indonesia, Portugal’s coast and islands (the Algarve, the Lisbon and Silver Coasts and Madeira), Spain (the Balearics, the Canary Islands, the Costa del Sol and the Costa Brava), Dubai in the UAE, the Thai islands (Phuket, Koh Samui and Koh Phangan), holiday homes in the Netherlands (the Zeeland coast, the Wadden Islands, the Veluwe and South Limburg), the Greek islands (Crete, the Cyclades, the Dodecanese and the Ionian), Italy (Puglia, Sicily, Tuscany, Sardinia, the Amalfi Coast, Liguria and the lakes, opening region by region), and the Dutch Caribbean ABC Islands (Aruba, Bonaire and Curaçao — our smallest catalogue, and each island taxed under its own rules). Thirteen further markets publish live Airbnb market data without a for-sale catalogue yet: Croatia, France, Mexico, the Philippines, Vietnam, Austria, Montenegro, Cyprus, Mauritius, Barbados, St. Martin / Sint Maarten, Turks & Caicos and St. Barts. Eight more are in daily calendar collection but not published yet — Morocco, Australia, Costa Rica, Turkey, South Africa, Japan, Norway and Sweden — so we show how many listings are tracked in each and no occupancy rate until their history is long enough to support one. Behind the scenes the calendar pipeline already covers 25+ countries, so a new market launches with performance history in place.
Where does the Airbnb data come from?
From Airbnb itself. Our data engine, BrixfoxDNA, has tracked hundreds of thousands of listings since March 2026 and re-reads the availability calendar of every active one daily. Comparing consecutive snapshots shows which nights were actually booked, which is how we measure occupancy instead of estimating it. Nightly rates are read from the listings’ asking prices and corrected where booked rates are observed. Published market figures are medians across actively-rented listings over the trailing quarter, so a listing that barely rents does not drag the number down — and the page says so wherever a figure is shown.
Is buying an Airbnb or a holiday home abroad a good investment?
It can be — if you buy on real numbers instead of brochure projections. The spread between an average and a well-chosen Airbnb in the same area is often the difference between a negative and a double-digit return. That is how to evaluate an Airbnb investment or a holiday home abroad: on measured occupancy and nightly rates, the full cost of buying in that country, and the return you keep after tax. Brixfox shows exactly that — true net yield (after purchase costs, taxes and management) built from real Airbnb occupancy and nightly rates around each property — so you can judge every listing the way an analyst would before you commit.
Where is the best place to buy an Airbnb investment property?
It depends on the trade-off you want. Bali offers the highest net yields at lower entry prices (mind the leasehold years), Portugal and Spain combine freehold EU ownership with strong yields but licence rules per region, Dubai adds tax-free rental income, Thailand pairs high measured occupancy with a foreign-freehold condo route (short letting sits under the Hotel Act — check the building), the Netherlands is a stable drive-to holiday-home market where the park contract decides how you may let and Box 3 replaces income tax, and the ABC Islands give year-round Caribbean demand in USD. Brixfox ranks live for-sale inventory in every covered market by the same yield basis, so you can compare them like-for-like — and the live data hubs let you compare the next markets before their catalogues open.
How does Brixfox calculate net yield?
Gross yield is annual short-term-rental revenue divided by the asking price — the one like-for-like basis we use on every market row. Net yield then deducts operating costs and management, the taxes that apply to a non-resident owner in that market, and divides by the all-in acquisition cost — the price plus that market’s transfer tax, stamp duty, notary, legal, furnishing and short-term-rental launch costs. Each market has its own cost model (Portugal’s IMT and stamp duty, Spain’s ITP transfer tax and non-resident income tax, Dubai’s 4% DLD fee and trustee and agent fees, Bali’s notary, due diligence and furnishing on a leasehold assignment, and on a freehold purchase BPHTB, the title conversion and a PT PMA company’s setup, with its yearly compliance as an operating cost, Indonesian and Thai rental income tax, the Dutch Box 3 levy, Italy’s registration tax on the cadastral value, the agency commission an Italian buyer pays and the cedolare secca, a flat 21% of gross rent), and every listing page states which management scenario its net figure assumes. To compare markets like-for-like, every market row and landing page quotes the same scenario — fully managed, after that country’s tax, over the all-in acquisition cost — and ranks the markets by the median of each one’s top 10% by BrixfoxScore, with the whole-catalogue median as context.
How does Brixfox rank rental properties?
Every listing gets a BrixfoxScore from A+ to F, built from measured rental demand, projected return and payback, location, land and building, ownership security (leasehold years where they apply), zoning and photo quality. It is a quality score, not a yield sort: the yields we quote for a market’s top 10% are the median inside its best-scored decile, so stale prices and short-tail leaseholds cannot inflate them.
Can I estimate what a property would earn on Airbnb before it is listed for sale?
Yes. The free Airbnb calculator at brixfox.com/airbnb-calculator takes a location and bedroom count and returns expected occupancy, nightly rate and annual revenue from the actual Airbnb listings we track around that spot, with the comparable listings and a confidence score shown. It covers every market above, including the ones without a for-sale catalogue yet.
Is Brixfox free to use?
Yes — a free account includes unlimited full property analyses (the complete underwriting view, not a teaser) and unlimited browsing, with no credit card required. Pro and Agency subscriptions add the investor extras: income and payback sorting, direct agency listing links, included underwriting reports and AI research tools.
Can I get a full report for a single property?
Yes. Property pages in Bali, Portugal, Greece, Italy, the Netherlands or Dubai offer a one-time underwriting report — the listing’s purchase costs, its line-by-line P&L, occupancy and offer what-ifs, and the market’s ownership, tax and letting rules, on the same figures the page shows — for $49 (€49 for visitors in the EU/EEA, UK and Switzerland), with no subscription needed. It is offered wherever the listing’s costs are itemised, and in more markets as their figures are season-corrected.
Start your short-term rental investment on real numbers
Free account, unlimited full analyses, no card. The independent underwriter for Airbnb and vacation-rental buyers investing abroad.